- (Exam Topic 3)
You are optimizing a Power Bl data model by using DAX Studio.
You need to capture the query events generated by a Power Bl Desktop report. What should you use?
Correct Answer:
C
The All Queries trace in Dax Studio supports capturing the query events from all client tools (not just queries sent from DAX Studio like the Query Plan and Server Timings features do). The ‘All Queries” trace is really useful when you wish to see the queries that are generated by a client tool like Power BI Desktop.
Reference: https://daxstudio.org/documentation/features/all-queries-trace/
- (Exam Topic 3)
You are planning a Power Bl solution for a customer.
The customer will have 200 Power Bl users. The customer identifies the following requirements:
• Ensure that all the users can create paginated reports.
• Ensure that the users can create reports containing Al visuals.
• Provide autoscaling of the CPU resources during heavy usage spikes.
You need to recommend a Power Bl solution for the customer. The solution must minimize costs. What should you recommend?
Correct Answer:
A
Announcing Power BI Premium Per User general availability and autoscale preview for Gen2. Power BI Premium per user features and capabilities
* Pixel perfect paginated reports are available for operational reporting capabilities based on SSRS technology. Users can create highly formatted reports in various formats such as PDF and PPT, which are embeddable in applications and are designed to be printed or shared.
* Automated machine learning (AutoML) in Power BI enables business users to build ML models to predict outcomes without having to write any code.
* Etc. Note:
Power BI empowers every business user and business analyst to get amazing insights with AI infused experiences. With Power BI Premium, we enable business analysts to not only analyze and visualize their data, but to also build an end-to-end data platform through drag and drop experiences. Everything from ingesting and transforming data at scale, to building automated machine learning models, and analyzing massive volumes of data is now possible for our millions of business analysts.
Reference:
https://powerbi.microsoft.com/nl-be/blog/announcing-power-bi-premium-per-user-general-availability-and-auto
- (Exam Topic 3)
You are using an Azure Synapse Analytics serverless SQL pool to query network traffic logs in the Apache Parquet format. A sample of the data is shown in the following table.
You need to create a Transact-SQL query that will return the source IP address.
Which function should you use in the select statement to retrieve the source IP address?
Correct Answer:
A
- (Exam Topic 3)
You open a Power Bl Desktop report that contains an imported data model and a single report page.
You open Performance analyzer, start recording, and refresh the visuals on the page. The recording produces the results shown in the following exhibit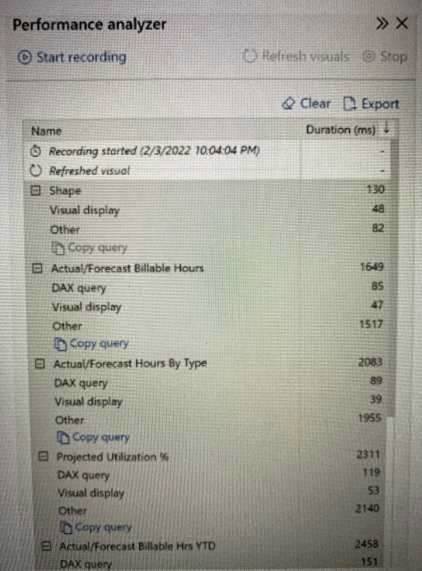
What can you identify from the results?
Correct Answer:
D
Most time is spent in the category Other - time required by the visual for preparing queries, waiting for other visuals to complete, or performing other background processing.
Note: Each visual's log information includes the time spent (duration) to complete the following categories of tasks:
DAX query - if a DAX query was required, this is the time between the visual sending the query, and for Analysis Services to return the results.
Visual display - time required for the visual to draw on the screen, including time required to retrieve any web images or geocoding.
Other - time required by the visual for preparing queries, waiting for other visuals to complete, or performing other background processing.
Reference: https://docs.microsoft.com/en-us/power-bi/create-reports/desktop-performance-analyzer
- (Exam Topic 3)
You are configuring Azure Synapse Analytics pools to support the Azure Active Directory groups shown in the following table.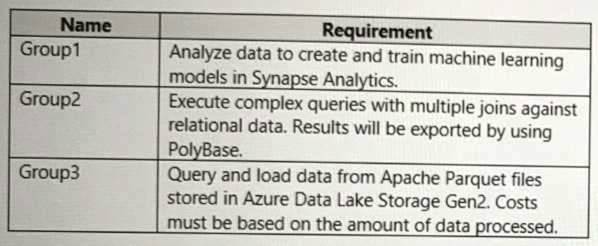
Which type of pool should each group use? To answer, drag the appropriate pool types to the groups. Each pool type may be used once, more than once, or not at all. You may need to drag the split bar between panes or scroll to view content.
NOTE: Each correct selection is worth one point.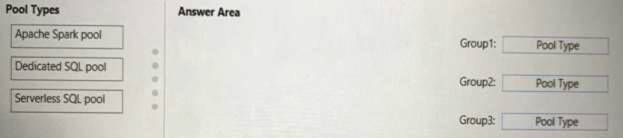
Solution:
Box 1: Apache Spark pool
An Apache Spark pool provides open-source big data compute capabilities. After you've created an Apache Spark pool in your Synapse workspace, data can be loaded, modeled, processed, and distributed for faster analytic insight.
Box 2: Dedicated SQL Pool
Dedicated SQL Pool - Data is stored in relational tables Box 3: Serverless SQL pool
Serverless SQL pool - Cost is incurred for the data processed per query
Reference:
https://docs.microsoft.com/en-us/azure/synapse-analytics/quickstart-create-apache-spark-pool-portal
https://www.royalcyber.com/blog/data-services/dedicated-sql-pool-vs-serverless-sql/
Does this meet the goal?
Correct Answer:
A